The Biggest Secret to RSI Indicator Trading Success?
The Biggest Secret to RSI Indicator Trading Success? Overbought or Oversold in Stock and Forex.
How to Use RSI to evaluate overbought or Oversold in Forex and Stock?
The
Relative Strength Index (RSI) is an important momentum indicator that helps
traders evaluate situations where a stock or forex pair is overbought or
oversold.
How to Use RSI Indicator as a Signal Source?
Any
time low RSI levels are recorded, below 30, 25, and 15, it shows an' Oversold'
condition. It helps the trader in generating a potential buy/put/purchase
signal. On the other hand, if it is over 75, 85, 95, or 100 levels, it
indicates that the pair is overbought hence generating a sell signal.
How to customize the RSI indicator to show overbought and oversold on MT4
Step One: Click the indicators icon on your MT4 platform.
Step Two: On the Indicator Window 1, type the (+) icon.
Step Three: Scroll down to the Oscillators and click 'Relative Strength Index'
Step Four: Click the levels tab at the bottom of the page.
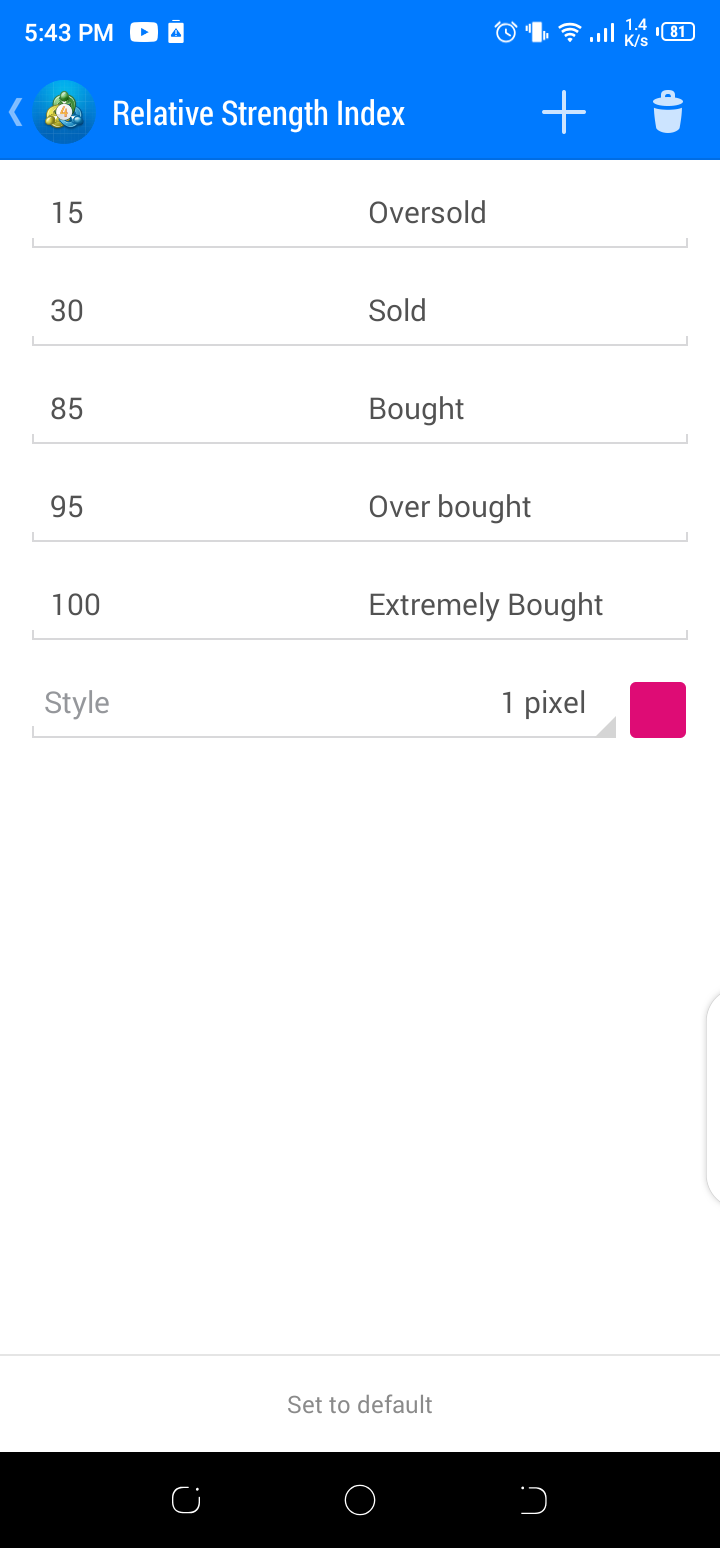
Step Five: Click the (+) icon and type 15, 30, 85, 95, and 100.
Step Six: In the description area write the following:
15
–Oversold
30-Sold
85-Bought
95-
Overbought
100-Extremely
Bought.
Please
watch the below video for a better and more practical showcase on customizing
and setting up the Relative Strength Index.
➘


Informative Content
One of the standout features of the RSI Secret Indicator is its simplicity. Even for those new to trading, the indicator provides clear and straightforward signals, making it easy to understand and implement in real-time trading scenarios.
Good opportunity