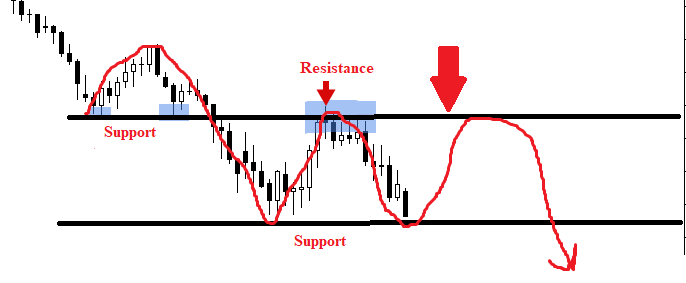
What are Support and Resistance Levels in Forex, Indices, and Commodities
Support and Resistance Levels in
Forex, Indices, and Commodities
Price
makes a zigzag pattern on any trend chart as it moves up and down. Anytime the price
goes up, then pulls back (high-high and high-low), the high point is the
Resistance. In simpler terms, it might represent a price level where a
potential uptrend pattern is reversed as a minor or major sell-off. As a
result, any pair's resistance levels indicated a potential presence of sellers'
surplus.
After
the sell-off, the lowest possible point the price reaches before it begins its
journey back is the Support. In simpler terms, it is the price level where a
potential downtrend paused due to a surplus of buyers. It implies that Support
and Resistance are created as the price moves up and down on a trend chart.
How to trade with Support and Resistance?
After
a thorough technical analysis and confirmation that the pair is in a continuous
uptrend, buy when the price touches the Support and sell where the price
reaches the Resistance.
What Indicators for Support and Resistance?
Admiral
Support
Wolfe
Waves
Fibonacci
Support and Resistance


