What is the U.S Dollar Currency Index (DXY) Overview Today?
U.S Dollar Currency Index (DXY) Overview
U.S
Dollar Index Overview: For the last one year and three months, the U.S Dollar
Index (DXY) has maintained a bullish momentum, as evident on the daily chart.
With that in mind, a few questions pop up for both retail and wholesale
traders.
What is the symbol for U.S. Dollar Index? DXY is the symbol for U.S Dollar Index
Is
USD going up or down? The U.S dollar has maintained a bullish trend since June
2021. The positive move could be attributed to the U.S economy recovering and
the decision by FED (Federal Research to support the economy. Predictions by
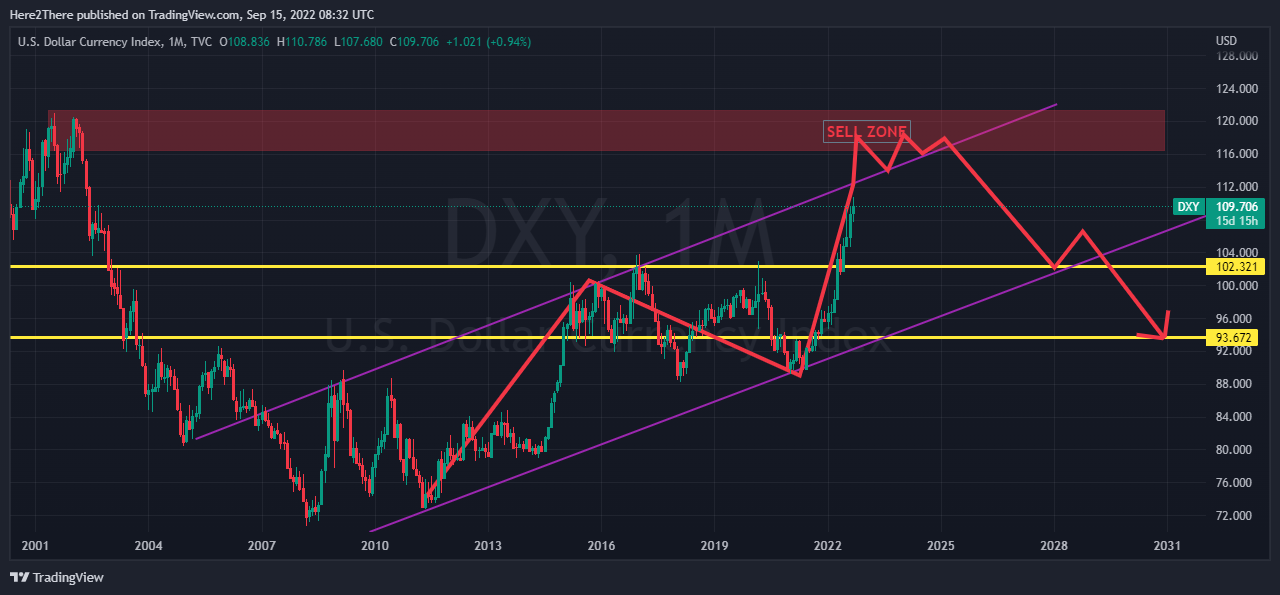
Analyticdave show that the Bullish trend on U.S Dollar Index could last until
the 113-120 zone is breached. However, the U.S Dollar Index is currently
showing signs of exhaustion which might result in an unprecedented drop in a
few weeks.
How is U.S. Dollar Index calculated? DXY strength is measured relative to the value of other foreign currencies (Forex exchange rates).
What
is a good dollar index? If the U.S Dollar manages to achieve the 120 value,
then, it will be clear that the dollar has appreciated by 20% versus the other
currencies. It gains more strength and value as it goes up compared to other
currencies such as Euro.
Technical Analysis of DXY (U.S Dollar Index)
On
the One Month, Weekly, Daily, and 4 Hour Charts, the DXY price is still
maintaining a strong bullish channel. For that reason, Analyticdave maintains a
bullish bias until we hit the 113 to 120 zone, where possible reversible will
be imminent. The first resistance will be around 110. 78. Although the
resistance might seem weak, there is a high chance that it will send DXY back
to the first support around 109.31. Depending on the news, a complete reversal
below the 109 zones could be witnessed. Following the above discoveries, DXY buys,
or sell remains undefined until a proper channel is established.


