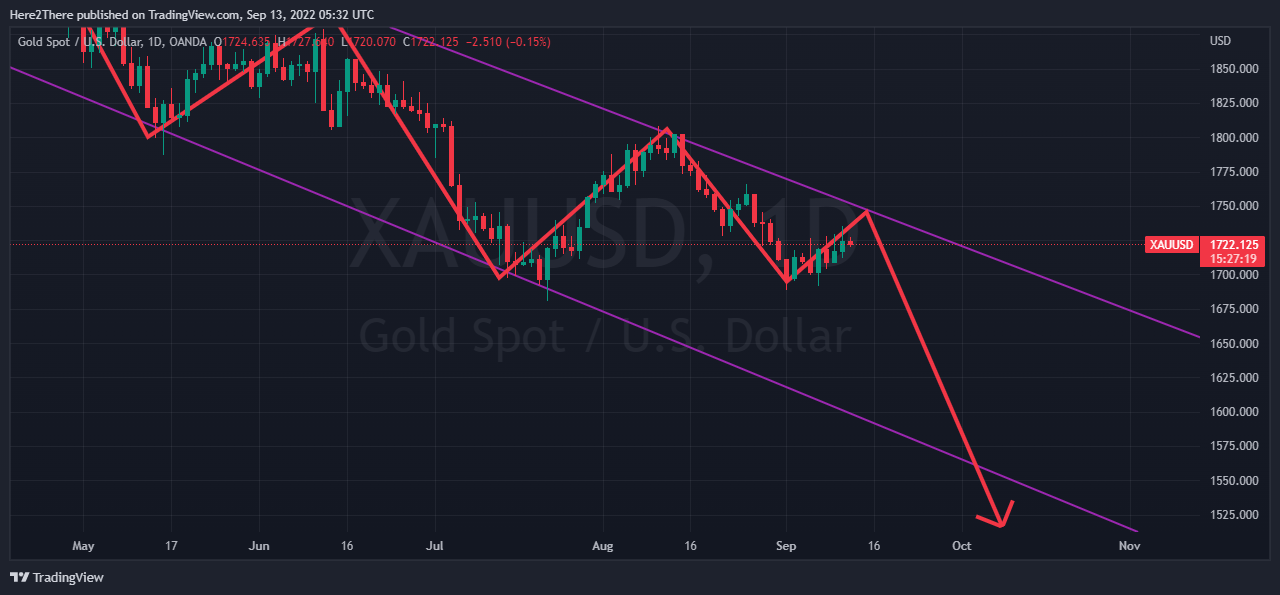
What is the Trend of XAUUSD Today? XAUUSD Technical and Fundamental Analysis
XAUUSD Technical and Fundamental Analysis
On
the 4-HR chart, XAUUSD Price has tried to drop from its 1st
resistance level. On the daily chart, there is a high potential that a minor
bullish bias to around 1721 to 1733 (38% Fibonacci retracement) will be touched
before the actual bearish trend is triggered. The 4-Hour chart shows the price
currently at the 78% Fib Extension. In a few hours, the price might drop to the
1st Support zone around 1713. 32, which represents the 50% Fibonacci
retracement. If the XAUUSD price breaks the level, the second support area will
be around 1690. If the 1721 to 1731 area is breached, there is a high chance
that the 1740 area will be eminent. However, in the long term, XAUUSD is on a
bearish trend.
|
|
|
|
#Is XAUUSD a buy or sell now? #What is the best strategy for XAUUSD? #Is XAUUSD bearish or bullish? #What affects XAUUSD price? #xauusd news today #xauusd analysis today #gold analysis today #gold technical analysis today #xauusd today buy or sell #gold analysis today tradingview #xauusd prediction #gold price analysis forecast
|
xauusd today buy or sell xauusd forecast tomorrow xauusd technical analysis
today xauusd news xauusd forecast tradingview xauusd forecast next week xauusd live
|


