What is the USDJPY Trend Today? Technical and Fundamental Analysis
USDJPY Technical and Fundamental Analysis Today
Technically,
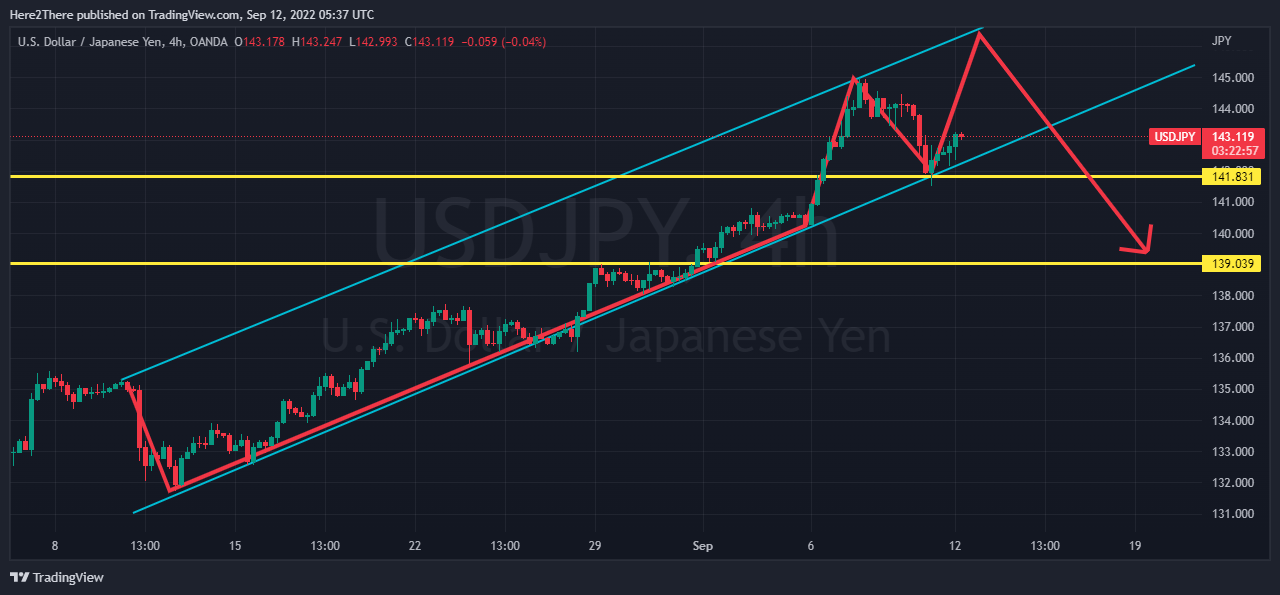
the 4 Hour chart for USDJPY Trend and Pattern analysis shows a strong ascending
channel. The Bullish potential could take USDJPY to a high of 146.48 (161.8%
FIB extension) from the current price of 141.74 (Support around the 23.6%
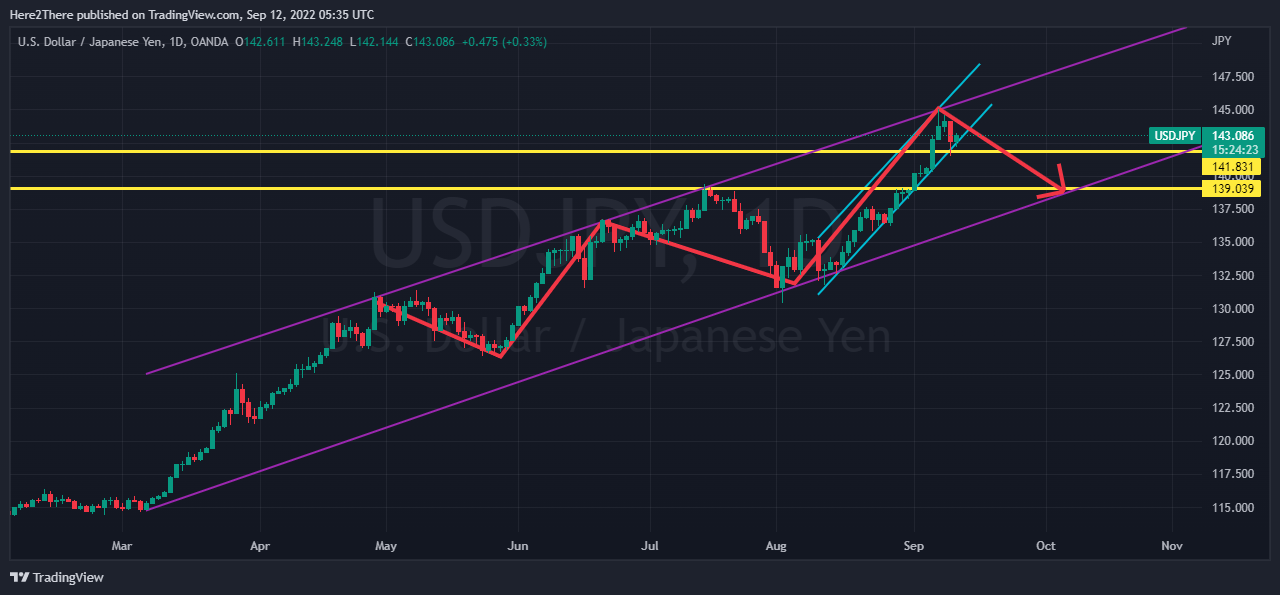
Retracement). However, while looking at the daily chart (1-Day Chart), a
stronger bearish trend is awaiting. The bearish momentum has the ability to
push the price from a high of 146.48 to a lower of 139. 33 (around the 38.2%
retracement).
Important News: Fundamental Analysis
The
Japanese Yen (JPY): No Major News Today
However,
as the DXY (U.S. Dollar Index) weakens, there is a high potential of USDJPY
dropping. Moreover, it will be important to pay attention to the comments and
sentiments from the Bank of Japan (BOJ) on the weakening Yen. Although there is
a bullish bias on the 4-Hour chart, the long-term indicators on the daily chart
point to a stronger bearish trend in the coming days/weeks.
The U.S. Dollar Index Today
Currently,
the DXY is consolidating around the 108.60 price level. With no significant
news for the U.S, less is expected from the pair. Consequently, it is important
to consider whether DXY manages to break the consolidation front. The key focus
area is 107.18, which represents the next support level. That said, USDJPY will
have a short-term bullish trend, and a possible bearish trend as we get into
the week.
Analyticdave USDJPY Bias: Bearish in Longterm


